Flash - Chart Alert
Gold is not nor has ever been a 'safe haven'.

This is another in my new series of mid-week Alerts that offer analysis of setups in a major market which offers lessons in how to keep abreast of the changing trends. I will select from individual shares, indexes, currencies, commodities, Gold/Silver and Bitcoin.
THIS POST IS FOR PAID SUBSCRIBERS ONLY
GOLD UPDATE
One of the many myths surrounding financial markets is that Gold always acts as a safe haven in times of financial stress.
A simple debunk is to observe that last year Gold’s historic boom (+80%) was accompanied by the S&P 500 which gained 11% (which is above its much quoted average annual appreciation of 8%). Stress? What stress?
Of course last year the US Dollar was hit and lost 11% in the year - well under the appreciation in Gold. So what other factors can be invoked to account for Gold’s stunning performance?
Scanning the pundits I see that nobody really has a clue - they are floundering around trying to rationalise the action using rational arguments. They don’t work.
Experienced Tramline Traders know that the huge rally in PMs was being confidently forecast from a study of the Elliott wave patterns in late 2022. I alerted my readers to the setup back then and made a high confidence forecast.
And why can the study of Elliott waves offer such forecasts? It is simply because they reflect the buying and selling swings up and down as the bull and bear forces battle it out as sentiment waxes and wanes.
And sentiment is irrational. Buyers and sellers are motivated by unconscious internal drives that trace out the patterned waves on the chart. Remember that buyers rarely buy if they believe the price will fall. And sellers rarely sell if they believe the price will rise. So why not wait?
Because they act irrationally. Of course there may be forced buyers and sellers and the short squeeze is such an event. But these are usually short lived.
Yes, short term moves can be influenced by the news but the longer term trends are traced out by changes in sentiment .
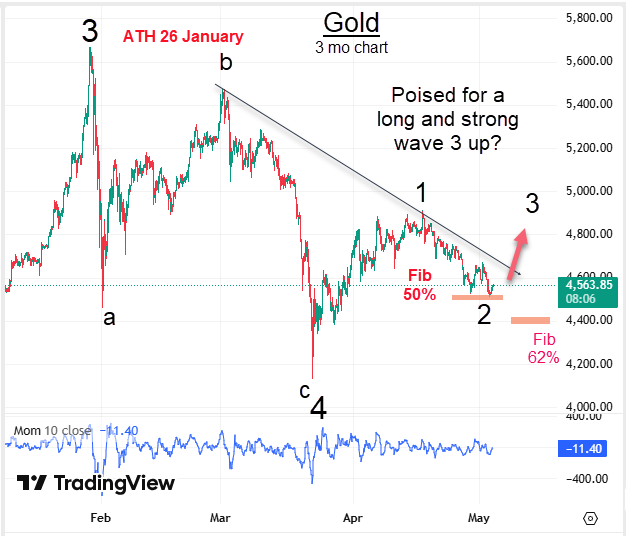
In previous posts I stated that the 28 January ATH at $5,600 area marked the end of my wave 3. From there I expected a wave 4 correction before launching into a final wave 5 up to well above the wave 3 high. I am staying with that forecast.
So where are we now in the wave 4 development? Remember I did warn that fourth waves are notoriously difficult to navigate and this one is no exception. The swings are wide. This is the current picture: