Flash: Chart Alert
Palantir is at a critical juncture

This is another in my new series of mid-week Alerts that offer analysis of setups in a major market which offers lessons in how to keep abreast of the changing trends. I will select from individual shares, indexes, currencies, commodities, Gold/Silver and Bitcoin.
THIS POST IS FOR PAID SUBSCRIBERS ONLY
PALANTIR makes headlines
Palantir is a controversial company with fingers in many pies. The bulls believe it is taking over the world of data analytics. The bears believe it is way overvalued. That is why the price swings have been major - here is the chart:
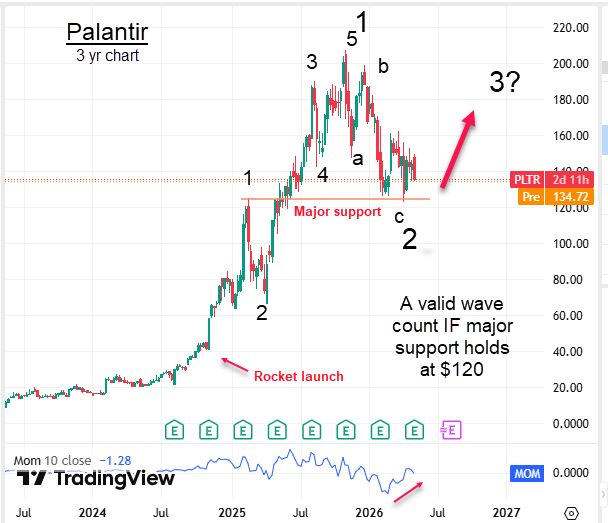
The shares began its rocket launch in late 2024 from the sleepy $30 region and exploded to the ATH in November at $206.
The form of the advance shows a clear textbook impulsive Elliott wave five up pattern. And the decline off that ATH shows a clear three down a-b-c.
So far so textbook.
Latest results showed blockbuster earnings in last quarter but did the shares surge as a result? Of course not!
Conventional analysts then embarked on a mass head-scratching exercise. Here is one headline: Palantir’s stock falls despite upbeat earnings.
Ah yes, Walls Street’s favourite excuse word - despite. The decline on ‘good’ news just did not fit into their philosophy - so they ignore it. That is just intellectual dishonesty. Either your beliefs hold up in all circumstances or you should look for something better. But journalists are lazy and take the career-safe line. Moving off-message would make them pariahs.
But TRramline Traders know why the shares fell - it was in a c of 2 wave down that had not completed. That’s it.
I have drawn a support bar that covers the wave 1 high on the way up and also the recent lows. This is a highly critical area.
OK, now with the market nearly testing the major support area around $120 any sharp break would indicate more downside. But if the support area holds, we should be starting a large wave 3 up likely into new ATHs.
Warning: The S&P Software index has gone vertical into new ATHs. This is an unstable situation. At some stage we should see a hefty pull-back at the least that could include Palantir.
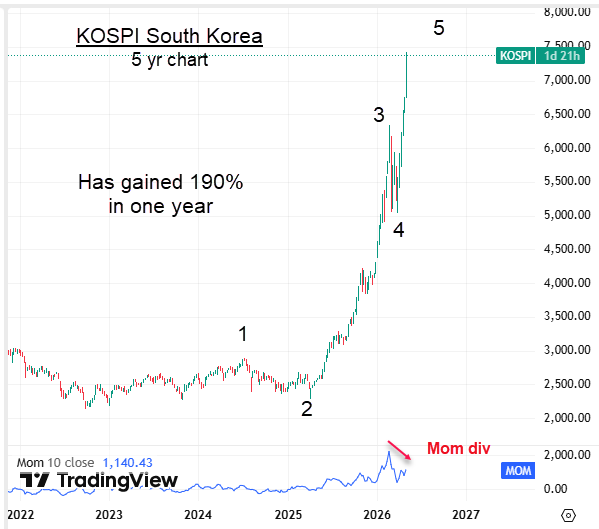
The Amazing Kospi - up nearly 200% in a year
South Korea is the global home of the chip foundries. And the companies that make them are certainly not soggy! In fact they are leading international tech shares up vertical slopes.